ML(머신러닝) :: Cost Function(비용함수) for Linear regression

What is the Cost function?
And relation with the performance of an ML model.

1. What is the Cost Function for Linear regression?

  It is a function that measures the performance of a Machine Learning model for given data. Cost Function quantifies the error between predicted values and expected values and presents it in the form of a single real number.
 
  Through Cost Function we could find out the most relevant linear function with given data. To find such function we have to know how to choose θ0 and θ1. Because we could get different hypothesis function(hθ(x)=θ0 + θ1x) depend on the value of θ0 and θ1.
 
From now on, I will denote the hθ(x) as h(x) for convenience.
 

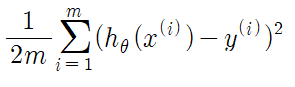
  In Linear regression, we gonna try to solve the ‘minimization problem’. For this, we have to minimize the value of h(x)-y. To be exact it would be the below formula, rather than h(x)-y. For example, the value that subtracts real housing price from predicted housing price. For these reasons, the Cost Function is also called ‘squared error function’ or ‘squared error cost function’.

Cost function for linear regression
  For sure, Other Cost Functions also function pretty well. But in a regression problem, the square cost function is prevalent and quite reasonable.
 

2. Cost Function – Intuition 1

  To visualize Cost Function, We will simplify the hypothesis function like the below formula. Our purpose is finding out the minimum value of J(θ1)
hypothesis to be used for cost function* 
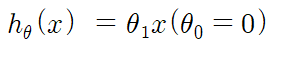
Notice that hθ(x) is a function of x, whereas J(θ1) is a function of θ.
 

3. Cost Function – Intuition 2

  From now on, we will learn about the way how to utilize two parameters θ0 and θ1, instead of just applying θ1.
 

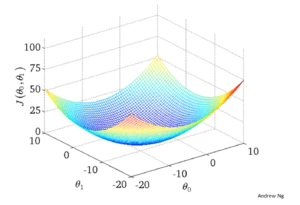
  Cost Function of θ1, I mean J(θ1), has a plot that looks like a quadratic function. J(θ0, θ1) is also similar in that it also has a bow-shaped function. But it has a 3- dimensional surface plot.


3D surface of cost function

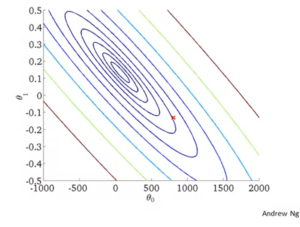
  And rather than to show the plot of Cost Function J, like above 3D surface, we will use contour plots(contour figures) like below.

contour plots of cost function
contour plots

Read More

Contents in the post based on the Coursera Machine Learning course, taught by Andrew Ng.

Leave a Reply

Your email address will not be published. Required fields are marked *